|
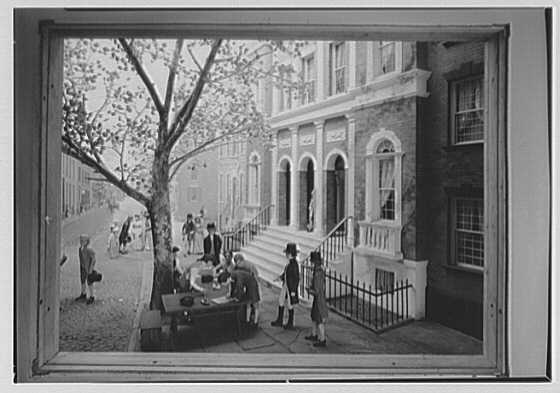 Buttonwood Agreement
- May 1792
(http://memory.loc.gov/pnp/gsc/5a12000/5a12000/5a12096r.jpg)
Buttonwood Agreement
- May 1792
(http://memory.loc.gov/pnp/gsc/5a12000/5a12000/5a12096r.jpg)
1602
- Shares of Dutch East India Company (Vereenigde Oost-Indische
Compagnie - V.O.C.) began trading on Amsterdam stock exchange
(States-General of the Netherlands sponsored creation of single
"United East Indies Company", granted 21-year monopoly over
Asian trade; empowered to build forts, maintain armies, conclude
treaties with Asian rulers; financial accounting only at end of
each decade); first multinational corporation in world, first
company to issue stock; beginning of trading in global equities.
1609
- Isaac le Maire, 8 others founded Grote
Compagnie, secret company to trade in shares of
Vereenigde Oost-Indische Compagnie, company with monopoly patent
on trade via Cape of Good Hope, Strait of Magellan, only known
routes to Indies; sold VOC shares short = original short-seller
(Le Maire had been merchant for the
Vereenigde Oostindische Compagnie, became largest shareholder in
1602 when all Dutch trading companies merged into VOC; forced
out in 1605 over rumors that he did not submit receipts to share
costs); 1610
- States-General of the Netherlands prohibited short sales of
VOC stock; 1610-1611
- VOC stock rose about 200%; Le Maire suffered big losses; many
members of his company went bankrupt; Le Maire left Amsterdam;
1614 - founded
Austraalse Compagnie to discover passage from Atlantic to
Pacific Ocean (outside VOC trading monopoly); discovered passage
around Cape Horn, ships confiscated in breach of VOC patent;
1619 - court ruled
ship unlawfully seized; 1621
- Dutch West India Company established, awarded monopoly patent
on travels through Strait of Magellan, other routes region
(contrary to rights granted to Austraalse Compagni);
1622 -Le Maire
published his son's discoveries; court ruled that Austraalse
Compagnie not allowed to trade in Indian region, did have right
to travel across newly discovered route around Cape Horn;
1644 - decision
upheld.
 Isaac le Maire
- first short-seller
Isaac le Maire
- first short-seller
(http://www.christenhistorici.nl/photoshow.php?id=804&type=thumb)
May 17, 1792
- Twenty-four traders gathered under
buttonwood tree at 68 Wall Street in lower Manhattan to set
conditions, regulations of speculative market (Peter
Anspach, Armstrong & Barnewall, Andrew D. Barclay, Samuel Beebe,
G. N. Bleecker, Leonard Bleecker, John Bush, John Ferrers,
Isaac M. Gomez, John A. Hardenbrook, Bernard Hart, Ephraim Hart,
John Henry, Augustine H. Lawrence, Samuel March, Charles McEvers
Jr., Julian McEvers, David Reedy, Robinson & Hartshorne,
Benjamin Seixas, Hugh Smith, Sutton & Hardy, Benjamin
Winthrop, Alexander Zuntz); resulted in
Buttonwood Agreement - two-sentence contract gave
birth, in 1817, to New York Stock & Exchange Board (renamed New
York Stock Exchange in 1863); established stricter rules,
parameters to more effectively govern trading (previously
speculators had conducted auctions twice a day in various
locations, including street corners and coffeehouses); Bank of
New York - first corporate stock traded.
March 3, 1801 -
"The Stock Exchange" in London (known since 1773 as "New
Jonathan's", dealing room on ground floor and coffee room above
in building in Sweeting's Alley) reopened under formal
membership subscription basis; first regulated exchange in
London, birth of modern Stock Exchange.
1817
- Brokers formalized arrangement, created New York Stock &
Exchange Board with rented rooms on Wall Street; constitution
specified appropriate business conduct.
March 16, 1830
- New York Stock Exchange slowest day ever (31 shares traded).
October 25, 1861
- Toronto Stock Exchange created.
September 11, 1862 - Forty members organized
San Francisco Stock and Exchange Board (adopted by-laws, elected
officers) as marketplace for mining company stocks after
Comstock Lode strike, first mining exchange; rented room in
Montgomery Block; J. B. E. Cavallier President.
January 4,
1865
- New York Stock Exchange (NYSE) opened first
Corinthian-style structure permanent headquarters at
10-12 Broad near Wall Street in New York City;
1903 - more spacious quarters opened at 18 Broad
Street; trading floor still used today.
December 9, 1865 - New York Stock Exchange
opened in new home at 10-12 Broad Street in lower
Manhattan.
November 15, 1867
- First stock 'ticker' unveiled (name of sound its type wheel
made); idea of Edward A. Calahan, of Gold & Stock Telegraph
Company (configured telegraph machine to print stock quotes on
streams of paper tape); March 31,
1868 - Calahan received a patent for an
"Improvement in Telegraph Indicators" ("for the prices of gold,
stocks, etc....consists of a transmitting-instrument formed as a
disk, upon which are marked the signals, numbers or words to be
pointed out"); April 21, 1868
- received second patent or an "Improvement in
Printing-Telegraphs" ("for Registering Gold, Stocks,
etc....intended to accomplish...a correct record of various
fluctuations in the price of gold, stocks, and articles of
trade, and to have these fluctuations simultaneously and
periodically denoted and registered at the various centers of
business connecting with one central transmitting station");
assigned to Gold & Stock Telegraph Company;
November 9, 1869 -
Thomas Edison received patent for an "Electrical Printing
Instrument" ("Improvement in Printing-Telegraph Apparatus");
easier-to-use version of Calahan's ticker, Edison's first
lucrative invention; eventually replaced by computerized tickers
with electronic displays.
1868 - Membership on NYSE held as valuable
property; seats limited to 1,366; new members must buy
seats from existing members.
October 23, 1869
- New York Stock Exchange put memberships up for sale
for first time in seventy-seven-year history.
November 1, 1871
- NYSE passed stern law forbidding members from "dealing
with" non-members in "rooms of Exchange;" punishment
for infraction was suspension lasting
anywhere from sixty days to one year.
June 4, 1875 - Pacific Stock
Exchange opened.
May 15,
1878 - Tokyo Stock Exchange formed; first public
trading institution in Japan;
April 1, 1949 - Tokyo Stock Exchange, in current
form, founded; January 31, 2007
- TSE, NYSE agreed on alliance on technology, investment
products, more.
November
13, 1879 - New York Stock Exchange installed
telegraph, phone lines.
September 18, 1882
- 19 brokers signed charter, deposited $50 each,
organized Local Security Board to trade in stocks and
bonds of corporations other than mining shares; John
Perry, Jr., President; October 2, 1882 -
renamed San
Francisco Stock and Bond Exchange; March 1883
- daily list of quotations, transactions first printed;
September 1, 1883 - total business in
first year $9,490,621; January 2, 1957 -
merged with Los Angeles Oil Exchange (organized December
1899), renamed Pacific Stock Exchange;
1973
- renamed Pacific Stock Exchange; 1997 -
renamed Pacific Exchange; May 26, 2001
- trading floor closed, transferred to electronic
format, Archipelago Exchange; September 27, 2005
- acquired by Archipelago Holdings for $40 million,
10.8% equity stake.
December 15, 1886
- Record 1.2 million shares changed hands in frantic
trading.
May 26, 1896
- Charles Dow first published Dow Jones Industrial
Average of dozen 'smokestack' company stocks: American
Cotton Oil, American Sugar, American Tobacco, Chicago
Gas, Distilling & Cattle Feeding, General Electric,
Laclede Gas, National Lead, North American (utility),
Tennessee Coal & Iron, U.S. Leather (preferred), U. S.
Rubber; 1884 - Charles Dow's initial stock
average contained 11 stocks (9 railroad stocks) appeared
in "Customers' Afternoon Letter", daily, 2-page
financial news bulletin (precursor of the Wall Street
Journal); October 4, 1916 - list of 20
industrial stocks (all common shares) replaced previous
list of 12; October 1, 1928 - Dow Jones
Industrial Average 30 began, expanded from 20 to 30
stocks; divisor (16.67) introduced to adjust for effects
of stock splits, stock distributions, stock
substitutions.
October 7, 1896
- Dow Jones began reporting average of prices of
12 industrial stocks in Wall Street Journal.
May 28, 1897
- Dow Jones Industrial Average (12 stocks) moved up for
14 trading days in row (through June 14); total gain
of 3.75 points, 9.56%, closed at 42.96; longest streak
in history.

(http://external.globalfinance.net/Charts/DJIA_1900_2009.jpg)
March 29, 1900
- Louis Jean-Baptiste Alphonse
Bachelier, French mathematician, published
'Theorie de La Speculation'; argued that
markets were essentially random (could not be forecast
accurately); father of financial
mathematics.
 Louis
Jean-Baptiste Alphonse Bachelier
- Randomness
(http://www.gap-system.org/~history/Thumbnails/Bachelier.jpg)
Louis
Jean-Baptiste Alphonse Bachelier
- Randomness
(http://www.gap-system.org/~history/Thumbnails/Bachelier.jpg)
September 9, 1901
- Workers laid cornerstone for new NYSE building
at 18 Broad Street; 1903
- building completed (still open today); new quarters included trading floor over
twice size of predecessor.
November 9, 1903
- Panic of 1903 reached nadir--Dow dropped to 42.15
as stocks of industrial companies plunged to
single-digit lows; known as "Rich Man's Panic"; fiscal crisis dragged on for rest of year,
took severe toll on banks, steel and
iron producers.
1904
- National Quotation Bureau began as paper-based,
inter-dealer quotation service; linked competing market
makers in OTC securities across country; Pink Sheets, Yellow Sheets - central resource for trading
information in OTC stocks and bonds.
January 12, 1906
- Dow
Jones Average closed above 100 for first time.
1908 - American Stock Exchange traced roots
to traders officially organized as New York
Curb Agency; 1921
- moved indoors.
July 31,
1914 - Treasury Secretary William McAdoo closed
New York Stock Exchange; protected stock of gold in U.S., gave
young Federal Reserve System chance to get organized (opened on
November 16, 1914); set foundation for shift away from pound
sterling to dollar as international reserve currency after World
War I; concerned that sellers, mainly British and French, would
convert dollar proceeds to gold, ship it to Europe to finance
war efforts, effectively wipe out U.S. gold stock (young Federal
Reserve would have nothing to back its note issue, diminish its
credibility as central bank); insisted that U.S. remain on gold
standard while everybody else but England was going off of it;
signaled that U.S. determined to honor its foreign debt, prevent
massive devaluation of dollar; set foundation for shift away
from pound sterling to dollar as international reserve currency
after World War I (contrast with popular belief that Governing
Board of NYSE initiated closure of exchange in face of massive
sell-off in shares to protect share prices).
November
28, 1914 - New York Stock Exchange, closed since
July, re-opened for bond trading with set of restrictions
designed to keep markets from crumbling during war.
December 1, 1914
- San Francisco Stock & Bond Exchange became first U.S. exchange to re-open after nation's
markets temporarily shut down to safeguard against debilitating bear run with outbreak of World War
I.
December 12, 1914
- Dow Jones Industrial Average suffered worst percentage drop in history (since first published
in 1896) - 24.39% - on first day of trading
in more than four months (New York Stock Exchange
had shut down when World War I began in July); DJIA
dropped 40% late 1916 to early 1917.
December 15, 1914
- NYSE re-opened with tight set of trading restrictions
designed to prevent fiscal disaster.
November 29, 1918
- New York Stock Exchange Building Co. acquired
nearby Mortimer Building (fifteen years after NYSE moved
into new offices at 18 Broad Street); 1922
- Exchange opened new offices in
twenty-three-story tower, featured extra trading space,
dubbed the "garage."
January 2, 1919
- New York Stock Exchange installed separate
ticker to track bond trading.
October 2, 1922
- New York Stock Exchange opened new offices,
eleven-story building at 11 Wall Street.
1923 -
Standard and Poor's developed first stock market indicators;
covered 26 industry groups, 233 companies; introduced
base-weighted aggregate technique to gauge stock market
performance; 1926
- created 90 Stock Composite Price Index, comprised 50
Industrials, 20 Rails, 20 Utilities; base period of 1926=100,
calculated and published weekly; historical values available to
1918; "233", industry group indices re-based to 1926=100,
calculated and published weekly;
1928 - 90 Stock Composite Price Index
calculated, published daily; 1941
- "233" grew o 416, comprised 72 industry sub-groups; "416", 90
Stock Composite re-based to 1935-39=100;
1957 - "416" became Standard & Poor's
500 Composite Stock Price Index; introduced computers, permitted
"500" to be calculated, disseminated at one-minute intervals
throughout trading day; new "500" linked to 90 Stock Composite
Price Index; daily S&P 500 Index prices available to 1928; "500"
consisted of 425 Industrials, 60 Utilities, 15 Rails; base
period of 1941-43=10.
May 13, 1927
- "Black Friday" on Berlin Stock Exchange.
October 1, 1928
- Dow Jones Industrial Average expanded from 20 to 30 stocks.
May 21, 1929
- Sutro and Company of New York City put automatic
electric stock quotation board into operation.
August 9, 1929
- Brokers' loans set record for fourth successive week,
passed $6,000,000,000 mark for first time; directors of
Federal Reserve Bank of New York advanced rediscount
rate from 5% (level held since July 13, 1928) to 6%;
August 10 - Dow dropped
14.11 points to close at month-long low of 337.99; record-setting run
had lasted over a
year.
September 3, 1929
- Dow Jones Industrial Average closed at pre-Crash
high of 381.17.
October 29, 1929 (Black Tuesday)
- Stock prices collapsed on New York Stock Exchange
amid panic selling; most disastrous trading day in stock market's history;
billions of dollars in open
market values, thousands of investors, wiped out as
prices crumbled under pressure of liquidation of
securities which had to be sold at any price;
estimated that 880 issues on New York Stock Exchange
lost between $8,000,000,000 and $9,000,000,000 plus depreciation on
issues on Curb Market, in over the counter
market, on other exchanges; leading stocks rallied in final fifteen minutes of trading
in
measurable snapback from lows: American Can gained
10; United States Steel common, 7 1 /2, General
Electric, 12; New York Central, 14 1/2, Anaconda Copper,
9 1/2; Chrysler Motors 5 1/4; Montgomery Ward, 4 1/4 and
Johns Manville, 8; collapse started Thursday, October
24, when 12,800,000 shares traded on Exchange; storm broke again on
Monday across board in every industry, followed tremendous trading of 16,410,030 shares
on Tuesday.
February 2, 1932
- Federal Reserve announced ban on bank loans for
margin trades.
July 8, 1932 -
Stock market fell to
lowest point during Depression (41.22).
1935
- FT-30 index founded; 2007 - only three
companies from original FT-30 index still listed (GKN,
ICI, Tate & Lyle).
October 31, 1938
- New York Stock Exchange unveiled fifteen-point program
aimed to upgrade protection for investing public,
restore confidence.
April 1942
- Sidney B. Wachtel, international financial economist for U.S.
Treasury Department, published "Certain Observations on Seasonal
Movements in Stock Prices" (p. 184) in Journal of Business
(published by University of Chicago Press); coined term "January
Effect", theory that American stock prices rise more in January
than any other month; 1961
- founded Wachtel & Co., Washington-based investment. brokerage
firm.
May 16, 1949 -
Nikkei Stock Average published (price-weighted average of 225
top-rated Japanese companies listed in First Section of Tokyo
Stock Exchange); average price was ¥176.21, with divisor of 225.
March 12, 1956
- Dow Jones closed above 500 for first time (500.24).
March 1, 1957
- Standard & Poor's Corporation ( Standard
Statistics Company merged with Poor's Publishing in
1941) introduced S & P 500 Index (with daily estimates),
representative sample of 500 leading companies in
leading industries of U.S. economy (predecessor stock
market indicator - Standard Statistics Company Average
of Stock Prices developed in 1926 = 100); characterized
by: 1) approximately 75% of U.S. equities market
covered; 2) market capitalization weighted, 3) minimum o
$ 4 billion capitalization, 4) at least 50% public
float, 5) reconstituted as needed; 1957 -
a) 'materials' (steel, aluminum, chemical, paper,
mining) biggest industrial sector represented, b)
materials, energy = 50% of index value (12% in 2006); c)
AT&T largest company - $11.2
billion market capitalization;
1957-2006
- 1) average annual return of 10.83% ($1000 in S & P in
1957 = $168,000 in 2006); 2)
best performing company - Altria (old Philip Morris)
with 19.88% annual return ($1000 in 1957 = $8.4 million
in 2006); 3)
111 companies survived intact (PepsiCola, Coca-Cola,
Colgate Palmolive, Heinz, Wrigley, Procter & Gamble,
Hershey, Tootsie Roll Industries); 4) almost 1,000
companies have been added to index as others were
dropped (bankruptcies, mergers, corporate changes).
1960
- James
Lorie, Lawrence Fischer (University of Chicago Graduate School
of Business), with a grant of $ 300,000 from Merrill Lynch,
established Center for Research in Securities Prices (CRSP) at
University of Chicago (Fischer originated structure of CRSP
Master File; 1964
- completed stock market database (estimated to contain between
2-3 million pieces of information); allowed average rate of
return on common stocks to be measured for first time (9% on
NYSE-listed stocks); enabled rigorous empirical analysis of
stock prices, investment theories; allowed maintenance of
accurate securities information over time;
1984 - added data from NASDAQ markets
(from December 1972); mid 1990s
- created only complete database available containing active,
inactive mutual funds; 2005
- released CRSP/Ziman Real Estate Data Series (with Ziman
Center at the Anderson School of Business of UCLA);
2006 - released
Pre62 database (contained daily data from 1926 - 1962 vs. only
monthly data previously available).
February 12, 1970
- Joseph Louis Searles III became first black member of New York Stock Exchange.
February 8, 1971
- Gordon Macklin, president of National Association of
Securities Dealers opened NASDAQ (National Association of
Securities Dealers Automated Quotations); system went live via
cathode-ray terminals to more than 500 market-makers across the
U. S. in stocks of 2,500 companies; trading volume of 2.2
billion shares; 1973 - volume twice as big as
AMEX; 1983 - topped NYSE in single-day trading
volume seven times; 1987 - regulated activities of
almost 7,000 broker-dealer members with 400,000 employees;
listed 4.500 companies; trading volume of 30 billion shares;
2006 - Nasdaq Stock Market, Inc. (for-profit company
separate from NASD) trading volume of 482.3 billion shares (vs.
405.9 billion shares on the NYSE [608.2 billion shares in NYSE
composite volume]).
November 14, 1972
- Dow Jones Industrial Average closed above 1,000 for first time, at 1,003.16; International Business Machines, Wall
Street's best known glamour issue, moved up 11 1/4 points to
388, its best price of day; American Telephone rose 5/8 to
51 1/2, finishing at its highest price since early 1971; du
Pont, up 2 3/8 to 177 3/8, Chrysler, up 1 1/8 to 38 1/8;
Polaroid, up 6 to 115, Johnson and Johnson, 5 1/4 to 128 3/4;
Disney, 3 3/8 to 189; Motorola, 4 to 121 1/2; ARA Services, 5
3/4 to 142 3/4; Texas Instruments, 6 5/8 to 166, Xerox, 4
3/8 to 151 5/8.
1973
- Derivatives - Fisher Black, Myron Scholes
published Black-Scholes Option Pricing Formula in Journal of
Political Economy; specified first successful options pricing
formula (mathematics of
option pricing, dynamic hedging strategies using options and
other derivatives); described general framework
for pricing derivative securities, created financial
engineering; one of most important mathematical
tools in modem theory of finance (Black, F. and Scholes, M.
[1973]. "The Pricing of Options and Corporate Liabilities".
Journal of Political Economy, Vol. 86, p.637).
April 26, 1973 -
Chicago Board Options Exchange opened for trading (911 contracts
on 16 underlying stocks).
1974
- Michael Milken created market for high-yield bond trading;
based on research of W. Braddock Hickman, former
president of the Federal Reserve Bank of Cleveland (Corporate
Bond Quality and Investor Experience, Princeton, NJ: Princeton
University Press, 1958) - corporate default history 1900-1943:
diversified long-term portfolio of
non-investment-grade debt securities outperformed portfolio of
investment-grade debt, with the same level of risk.
May 1, 1975 -
New York Stock Exchange abolished fixed commissions per share on
trades in favor of negotiated commission rate structure;
wrought havoc on brokerage firm revenue-generating prospects.
1977 - LBOs -
Kohlberg Kravis Roberts & Co. (formed in May 1, 1976 by former
Bear Stearns executives Jerome Kohlberg, Henry Kravis, George
Roberts) financed $26 million leveraged buyout of A.J.
Industries, publicly-traded small manufacturer of brake drums
and other components (66% leverage financed with senior bank
debt); firms' first deal; couldn't persuade anyone to provide
subordinated debt (first LBO done in 1963 - Lewis B. Cullman
acquired Orkin Exterminating for $62.4 million with a $1,000
investment); May 14, 1979
- acquired Houdaille Industries in $355 million buyout; first
public-to-private transaction (leveraged buyout of a publicly
traded company); took almost one year to raise $355 million from
several banks, insurance companies for deal with 86% leverage
financed by multi-layered array of senior, subordinated
securities.
1977 -
Securitization - Salomon Brothers (Lewis S. Ranieri)
and Bank of America Corp. (BAC ) developed first private
(non-Government Sponsored Enterprise) mortgage-backed securities
(MBS); bonds pooled thousands of mortgages, passed homeowners'
payments through to investors (only 15 states recognized MBS as
legal investments); created "securitization," converting of home
loans into bonds that could be sold anywhere in world = capital
markets as source of funds for housing, commercial real estate;
1982 - developed
"collateralized mortgage obligation" (repackaged pools of
30-year mortgages into collections of 2-, 5-, and 10-year bonds
to sell to wide range of investors; seen as template for cutting
costs); led effort to obtain federal legislation to support,
build the market (Tax Reform Act of 1986);
1999 - size of market was $678 billion (41.6%
credit card receivables, 19.8% home equity loans, 11.8% auto
loans); 2008 -
size of market $531.2 trillion. (see graph below).
April 1977
- Junk Bonds - Drexel Burnham underwrote first junk
bond issue, Texas International;
end of 1978 - Drexel number one issuer;
used financial innovation as low-cost solution to
raising capital; created high-yield new-issue bond market;
1981 - issued
bonds for leveraged buyouts; 1983
- provided junk bond financing for hostile takeovers (leveraged
buyouts taken against incumbent directors’ will);
March 1985 -
completed first junk bond-financed hostile takeover.
August 12, 1982
- Bull Run of 1980s began, from level of 776.92 on Dow, five-year run
to 3000 point barrier; 1987 - 500-point crash.
February 24, 1983
- Dow Jones closed above 1100 mark for first time.
January 3, 1984
-
FTSE International, joint venture
of London Stock Exchange and The Financial Times (subsidiary of
Pearson),
compiled
FTSE-100,
capitalization-weighted index of 100 most highly capitalized
traded companies (base level of 1000); July
1, 2009-September 30, 2009 - best quarter in its
25-year history.
February 13, 1985
- Dow Jones closed at 1297.92 (record high) after topping 1300
earlier.
January
8, 1987 - The Dow Jones industrial average closed above
2,000 for first time, ended at 2,002.25.
April 21, 1987 - Dow Jones Industrial Average
soared 664.7; second biggest one-day gain in history.
March 12, 1987
- Dow Jones Industrial Average added Coca-Cola, Boeing Company;
dropped Inco Ltd., Owens-Illinois Glass.
July 17, 1987
- Dow Jones closed above 2,500 (2,510.04) for first time.
August 13, 1987
- Wall Street celebrated five-year anniversary of dawn
of Bull Run by shortly surging past 2,700-point mark; Dow Jones Industrial Average closed at 2,691.49;
August 17, 1987
-
closed above 2,700 for first time (2,700.57).
August 21, 1987 -
Bull run topped out at then-unprecedented 2772.4 points.
October 19, 1987
- Stock market crashed; Dow Jones Industrial
Average plunged 508 points (22.6%) -
second biggest percentage drop; 604 million share volume, nearly
doubled record; tape 2 hours late.
January 29, 1989
- Dow jumped 38.06 recouped 508-pt loss since Oct 1987; index at
2,256.43.
April 17, 1991 - Dow Jones industrial
average closed above 3,000 for first time.
October
30, 1991 - BET Holdings Inc. became first
African-American company listed on New York Stock Exchange.
February 23, 1995
- Dow Jones closed above 4,000 for first time (4,003.33).
November 21, 1995
- Dow Jones industrial average closed above 5,000 for first time.
December 15, 1995
- Big Board trading hit record: 652.8 million shares traded,
topped old mark of 608.2 million shares set on October 20, 1987.
October 14, 1996
- Dow Jones Industrial Average gained 40.62 to 6,010.00;
closed above 6,000 for first time.
November 25, 1996
- Dow charged past 6,500 for first time in history
(confidence in dollar, dwindling interest rates on U.S.
Treasury Bonds).
February 13, 1997
- Dow Jones industrial average broke 7,000
barrier for first time, closed at 7,022.44.
October 27, 1997
- By 2:00 P.M., Dow had dropped 323.42 points; Wall Street
invoked "circuit-breaker rules" (passed in wake of
1987 crash); mandated trading halts or "cooling off" periods to
be invoked when market dropped so many points that it seemed
headed for disaster; October 28,
1997 -
Dow surged to record gain of 337.1 points.
November 24, 1997
- Dow dropped 554.26 points, New York Stock Exchange officials
invoked the "circuit breaker" rule for first time;
halted trading; subsequent changes to "circuit breaker"
rules ensured that trading halts only implemented when
Dow Jones industrial average dropped by at least 10-20%.
April 3, 1998
-Dow Jones industrial average climbed above 9,000 for first time.
March 29, 1999
- Dow Jones industrial average closed above 10,000 for first time, at 10,006.78.
December 29, 1999
- Nasdaq composite index closed above 4,000 for first
time, ended at 4,041.46.
January 14, 2000
- Dow Jones Industrials closed at an all-time high,
11,722.98.
March 10, 2000
- NASDAQ Composite Index traded to intraday high of 5132.52,
closed at 5048.62, peak of Internet bubble;
October 2002 - hit low of 1108, loss of 78%.
 (source:
http://bigpicture.typepad.com/comments/images/wsj_infonasbubble0503_3.gif)
(source:
http://bigpicture.typepad.com/comments/images/wsj_infonasbubble0503_3.gif)
August 28, 2000 -
New York Stock Exchange began listing prices of seven stocks in
dollars and cents; previously all stock quoted in fractions.
September 17, 2001
- Wall Street trading resumed for first time since
Sept. 11 terrorist attacks - longest shutdown
since Depression; Dow lost 684.81 points,
worst-ever one-day point drop.
September 17, 2003
- New York Stock Exchange chairman Dick Grasso resigned
amid furor over his $139.5 million pay package.
March 8, 2006
- New York Stock Exchange went public.
October 19, 2006
- Dow Jones Industrial Average closed above 12,000 for
first time in history (12011.73, up 19.05).
April 25, 2007
- Dow Jones Industrial Average closed above 13,000, at
13,089.89, for first time, up 135.95 on volume of more
than 250 million shares.
July 19, 2007
- Dow Jones Industrial Average closed above 14,000 for
first time in history, at 14,000.41.
October 9, 2007
- S&P 500 traded to record high, 1,565.15.
November 5, 2007
- PetroChina, subsidiary of China's state-owned China National
Petroleum, first half 2007 revenues less than one-third of Exxon
Mobil, debuted on Shanghai Stock Exchange (13% of available
float), tripled in price, became most valuable company in
corporate history with market capitalization in excess of $1
trillion.
20-year winners
(October
19, 1987 - October 18, 2007) -
Twenty stocks in S&P 1,500
index that delivered highest total return
over 20 years, since 1987 stock market crash.
| Company |
20-year total return*
|
Business |
| International Game
Technology |
35,080% |
Casino gaming systems |
| UnitedHealth Group |
32,984 |
Health maintenance
organization |
| Jack Henry & Assoc. |
22,811 |
Computer systems for
financial institutions |
| NBTY |
20,451 |
Nutritional supplements
(Nature's Bounty) |
| WMS Industries |
19,060 |
Gaming, lottery machines |
| Kansas City Southern |
17,201 |
Railroad |
| Fastenal |
17,199 |
Distributes industrial
supplies |
| Oracle |
13,290 |
Business software |
| Weatherford Intl. |
12,923 |
Oil field services |
| Micros Systems |
12,876 |
Computer systems for
hospitality |
| Jefferies Group |
12,846 |
Investment banking |
| Best Buy |
12,283 |
Electronics retailer |
| Eaton Vance |
12,202 |
Mutual funds |
| Harley Davidson |
12,055 |
Motorcycles |
| Sierra Health Services |
11,770 |
Managed health care |
| Expeditors International
|
11,454 |
Transportation logistics |
| Microsoft |
11,447 |
Software |
| Amgen |
11,424 |
Biotechnology |
| Clear Channel
Communications |
11,219 |
Broadcasting |
*Includes share-price appreciation
plus dividends from Oct. 19, 1987, through Wednesday.
Returns are adjusted for splits and spin offs. Source:
FactSet Research Systems, SF Chronicle research;
http://www.sfgate.com/cgi-bin/article.cgi?file=/c/a/2007/10/18/BUODSRIN6.DTL&type=printabletrillion.
STOCK MARKET RETURNS: Annual Returns on
Stock, T. Bonds and T. Bills:
1928 - Current
(raw data from St. Louis Federal Reserve data site)
|
Annual Returns on
Investments in |
Compounded Value of $ 100 |
|
Year |
Stocks |
T.Bills |
T.Bonds |
Stocks
|
T.Bills
|
T.Bonds |
|
1928 |
43.81% |
3.08% |
0.84% |
$ 143.81
|
$ 103.08
|
$ 100.84
|
|
1929 |
-8.30% |
3.16% |
4.20% |
$ 131.88
|
$ 106.34
|
$ 105.07
|
|
1930 |
-25.12% |
4.55% |
4.54% |
$ 98.75
|
$ 111.18
|
$ 109.85
|
|
1931 |
-43.84% |
2.31% |
-2.56% |
$ 55.46
|
$ 113.74
|
$ 107.03
|
|
1932 |
-8.64% |
1.07% |
8.79% |
$ 50.66
|
$ 114.96
|
$ 116.44
|
|
1933 |
49.98% |
0.96% |
1.86% |
$ 75.99
|
$ 116.06
|
$ 118.60
|
|
1934 |
-1.19% |
0.30% |
7.96% |
$ 75.09
|
$ 116.41
|
$ 128.05
|
|
1935 |
46.74% |
0.23% |
4.47% |
$ 110.18
|
$ 116.68
|
$ 133.78
|
|
1936 |
31.94% |
0.15% |
5.02% |
$ 145.38
|
$ 116.86
|
$ 140.49
|
|
1937 |
-35.34% |
0.12% |
1.38% |
$ 94.00
|
$ 117.00
|
$ 142.43
|
|
1938 |
29.28% |
0.11% |
4.21% |
$ 121.53
|
$ 117.12
|
$ 148.43
|
|
1939 |
-1.10% |
0.03% |
4.41% |
$ 120.20
|
$ 117.16
|
$ 154.98
|
|
1940 |
-10.67% |
0.04% |
5.40% |
$ 107.37
|
$ 117.21
|
$ 163.35
|
|
1941 |
-12.77% |
0.02% |
-2.02% |
$ 93.66
|
$ 117.23
|
$ 160.04
|
|
1942 |
19.17% |
0.33% |
2.29% |
$ 111.61
|
$ 117.62
|
$ 163.72
|
|
1943 |
25.06% |
0.38% |
2.49% |
$ 139.59
|
$ 118.06
|
$ 167.79
|
|
1944 |
19.03% |
0.38% |
2.58% |
$ 166.15
|
$ 118.51
|
$ 172.12
|
|
1945 |
35.82% |
0.38% |
3.80% |
$ 225.67
|
$ 118.96
|
$ 178.67
|
|
1946 |
-8.43% |
0.38% |
3.13% |
$ 206.65
|
$ 119.41
|
$ 184.26
|
|
1947 |
5.20% |
0.38% |
0.92% |
$ 217.39
|
$ 119.87
|
$ 185.95
|
|
1948 |
5.70% |
0.95% |
1.95% |
$ 229.79
|
$ 121.01
|
$ 189.58
|
|
1949 |
18.30% |
1.16% |
4.66% |
$ 271.85
|
$ 122.41
|
$ 198.42
|
|
1950 |
30.81% |
1.10% |
0.43% |
$ 355.60
|
$ 123.76
|
$ 199.27
|
|
1951 |
23.68% |
1.34% |
-0.30% |
$ 439.80
|
$ 125.42
|
$ 198.68
|
|
1952 |
18.15% |
1.73% |
2.27% |
$519.62
|
$ 127.59
|
$ 203.19
|
|
1953 |
-1.21% |
2.09% |
4.14% |
$ 513.35
|
$ 130.25
|
$ 211.61
|
|
1954 |
52.56% |
1.60% |
3.29% |
$ 783.18
|
$ 132.34
|
$ 218.57
|
|
1955 |
32.60% |
1.15% |
-1.34% |
$ 1,038.47
|
$ 133.86
|
$ 215.65
|
|
1956 |
7.44% |
2.54% |
-2.26% |
$ 1,115.73
|
$ 137.26
|
$ 210.79
|
|
1957 |
-10.46% |
3.21% |
6.80% |
$ 999.05
|
$ 141.66
|
$ 225.11
|
|
1958 |
43.72% |
3.04% |
-2.10% |
$ 1,435.84
|
$ 145.97
|
$ 220.39
|
|
1959 |
12.06% |
2.77% |
-2.65% |
$ 1,608.95
|
$ 150.01
|
$ 214.56
|
|
1960 |
0.34% |
4.49% |
11.64% |
$ 1,614.37
|
$ 156.75
|
$ 239.53
|
|
1961 |
26.64% |
2.25% |
2.06% |
$ 2,044.40
|
$ 160.28
|
$ 244.46
|
|
1962 |
-8.81% |
2.60% |
5.69% |
$ 1,864.26
|
$ 164.44
|
$ 258.38
|
|
1963 |
22.61% |
2.87% |
1.68% |
$ 2,285.80
|
$ 169.16
|
$ 262.74
|
|
1964 |
16.42% |
3.52% |
3.73% |
$ 2,661.02
|
$ 175.12
|
$ 272.53
|
|
1965 |
12.40% |
3.84% |
0.72% |
$ 2,990.97
|
$ 181.84
|
$ 274.49
|
|
1966 |
-9.97% |
4.38% |
2.91% |
$ 2,692.74
|
$ 189.81
|
$ 282.47
|
|
1967 |
23.80% |
4.96% |
-1.58% |
$ 3,333.69
|
$ 199.22
|
$ 278.01
|
|
1968 |
10.81% |
4.97% |
3.27% |
$ 3,694.23
|
$ 209.12
|
$ 287.11
|
|
1969 |
-8.24% |
5.96% |
-5.01% |
$ 3,389.77
|
$ 221.59
|
$ 272.71
|
|
1970 |
3.56% |
7.82% |
16.75% |
$ 3,510.49
|
$ 238.91
|
$ 318.41
|
|
1971 |
14.22% |
4.87% |
9.79% |
$ 4,009.72
|
$ 250.55
|
$ 349.57
|
|
1972 |
18.76% |
4.01% |
2.82% |
$ 4,761.76
|
$ 260.60
|
$ 359.42
|
|
1973 |
-14.31% |
5.07% |
3.66% |
$ 4,080.44
|
$ 273.81
|
$ 372.57
|
|
1974 |
-25.90% |
7.45% |
1.99% |
$ 3,023.54
|
$ 294.21
|
$ 379.98
|
|
1975 |
37.00% |
7.15% |
3.61% |
$ 4,142.10
|
$ 315.24
|
$ 393.68
|
|
1976 |
23.83% |
5.44% |
15.98% |
$ 5,129.20
|
$ 332.39
|
$ 456.61
|
|
1977 |
-6.98% |
4.35% |
1.29% |
$ 4,771.20
|
$ 346.85
|
$ 462.50
|
|
1978 |
6.51% |
6.07% |
-0.78% |
$ 5,081.77
|
$ 367.91
|
$ 458.90
|
|
1979 |
18.52% |
9.08% |
0.67% |
$ 6,022.89
|
$ 401.31
|
$ 461.98
|
|
1980 |
31.74% |
12.04% |
-2.99% |
$ 7,934.26
|
$ 449.63
|
$ 448.17
|
|
1981 |
-4.70% |
15.49% |
8.20% |
$ 7,561.16
|
$ 519.28
|
$ 484.91
|
|
1982 |
20.42% |
10.85% |
32.81% |
$ 9,105.08
|
$ 575.62
|
$ 644.04
|
|
1983 |
22.34% |
7.94% |
3.20% |
11,138.90
|
$ 621.32
|
$ 664.65
|
|
1984 |
6.15% |
9.00% |
13.73% |
11,823.51
|
$ 677.24
|
$ 755.92
|
|
1985 |
31.24% |
8.06% |
25.71% |
15,516.60
|
$ 731.83
|
$ 950.29
|
|
1986 |
18.49% |
7.10% |
24.28% |
18,386.33
|
$ 783.79
|
$ 1,181.06
|
|
1987 |
5.81% |
5.53% |
-4.96% |
19,455.08
|
$ 827.13
|
$ 1,122.47
|
|
1988 |
16.54% |
5.77% |
8.22% |
22,672.40
|
$ 874.86
|
$ 1,214.78
|
|
1989 |
31.48% |
8.07% |
17.69% |
29,808.58
|
$ 945.46
|
$ 1,429.72
|
|
1990 |
-3.06% |
7.63% |
6.24% |
28,895.11
|
$ 1,017.59
|
$ 1,518.87
|
|
1991 |
30.23% |
6.74% |
15.00% |
37,631.51
|
$ 1,086.18
|
$ 1,746.77
|
|
1992 |
7.49% |
4.07% |
9.36% |
40,451.51
|
$ 1,130.39
|
$ 1,910.30
|
|
1993 |
9.97% |
3.22% |
14.21% |
44,483.33
|
$ 1,166.79
|
$ 2,181.77
|
|
1994 |
1.33% |
3.06% |
-8.04% |
45,073.14
|
$ 1,202.49
|
$ 2,006.43
|
|
1995 |
37.20% |
5.60% |
23.48% |
61,838.19
|
$ 1,269.83
|
$ 2,477.55
|
|
1996 |
23.82% |
5.14% |
1.43% |
76,566.48
|
$ 1,335.10
|
$ 2,512.94
|
|
1997 |
31.86% |
4.91% |
9.94% |
100,958.71
|
$ 1,400.65
|
$ 2,762.71
|
|
1998 |
28.34% |
5.16% |
14.92% |
129,568.35
|
$ 1,472.93
|
$ 3,174.95
|
|
1999 |
20.89% |
4.39% |
-8.25% |
156,629.15
|
$ 1,537.59
|
$ 2,912.88
|
|
2000 |
-9.03% |
5.37% |
16.66% |
142,482.69
|
$ 1,620.16
|
$ 3,398.03
|
|
2001 |
-11.85 |
5.73% |
5.57% |
125,598.83
|
$ 1,712.99
|
$ 3,587.37
|
|
2002 |
-21.98 |
1.80% |
15.12% |
97,996.61
|
$ 1,743.82
|
$ 4,129.65
|
|
2003 |
28.41% |
1.80% |
0.38% |
125,838.91
|
$ 1,775.21
|
$ 4,145.15
|
|
|
|
|
|
Risk Premium
|
|
|
Arithmetic Average |
|
|
|
|
Stocks - T.Bills
|
Stocks -
T.Bonds |
|
1928-2003 |
11.82% |
3.90% |
5.28% |
|
7.92%
|
6.54% |
|
1963-2003 |
12.10% |
6.01% |
7.40% |
|
6.09%
|
4.70% |
|
1993-2003 |
12.63% |
4.20% |
7.76% |
|
8.43%
|
4.87% |
|
|
|
|
|
Risk Premium
|
|
|
Geometric Average |
|
|
|
|
Stocks - T.Bills
|
Stocks -
T.Bonds |
|
1928-2003 |
9.85% |
3.86% |
5.02% |
|
5.99%
|
4.82% |
|
1963-2003 |
10.82% |
5.97% |
7.00% |
|
4.85%
|
3.82% |
|
1993-2003 |
10.87% |
4.19% |
7.30% |
|
6.68%
|
3.57% |
(http://pages.stern.nyu.edu/~adamodar/New_Home_Page/datafile/histretSP.html)
October 9, 2007 - Stock market's
all-time high; total value of all stocks covered by Dow
Jones Wilshire 5000 = just over $19.1 trillion; October
8, 2008 - total value = about $11.7 trillion, down $7.4
trillion (about 40).
December 31,
2007 - Dow Jones Industrial Average closed at
13,264.82, an annual increase of 6.43% (vs. 16.29% jump in 2006;
6.3% down from all-time high October 2007); S&P 500 index
(companies with median market value of $12.8 billion) closed at
1468.36, an annual gain of 3.53%, up 10% excluding financial
stocks (6.2% below record close on October 9, 2007; down 3.8% in
fourth quarter, first for any fourth quarter in seven years; up
67% since 2002; first November/December decline since 1974);
Russell 2000 closed at 766.03, down 2.8% in 2007 (first loss in
five years, underperformed S&P 500 for first time since 1998);
Nasdaq closed at 2652.28, up 9.81% for the year (down 7.2% from
record high in October 2007); Dow Jones Wilshire 5000 Index
(companies with median market value of $589.6 million), broadest
measure of U.S. shares, closed at 14,819.58 ($115 billion
decrease in value of stocks); Chicago Board Options Exchange
Volatility Index (VIX), market's "fear gauge'' (rises as stocks
fall), closed at 22.50 (up 95% percent in 2007, biggest annual
rise in its 18-year history).
Market Performance after Fed Rate Increases
(median performance of the S&P 500 for a given number of
trading days after successive Fed rate increases since
1946).
Rate
increase 7 days
22 days 126 days
252 days
First
-0.57% 0.76%
3.91% 9.87%
Second 0.05
0.96 3.93
6.45
Third
0.23 -0.36
3.46 -2.72
Fourth
0.33 1.95
-1.37 -2.79
Fifth
-1.44
-1.12 -5.38
-2.86
Sixth
0.13 -1.92
-5.20 -6.98
Source: Leuthold Group
 (http://www.cboe.com/micro/vix/images/VIX_since_1990.gif)
January
2008 - Peak to Trough Comparisons of Market Declines
 (http://graphics8.nytimes.com/images/2008/01/18/business/0118-biz-STOX-full.jpg)
L-R:
1/1/73-12/6/74 (-45.1%); 11/29/83-7/24/84 (-15.6%);
8/25/87-10/19/87 (-36.1%); 7/16/90-10/11/90 (-21.2%);
7/17/98-8/31/98 (-19.3%); 1/14/00-10/9/02 (-37.8%);
10/9/07-1/17/08 (-14.2%).
January 17, 2008
- NYSE Euronext agreed to acquire American Stock Exchange for
$260 millionto increase its business in options, exchange-traded
funds, cash products.
January 25, 2008
- Biggest Trading Losses by 'Rogue Traders'
 (http://graphics8.nytimes.com/images/2008/01/25/business/20080125_BANK.jpg)
 (source: Bloomberg;
http://graphics8.nytimes.com/images/2008/03/29/business/29-biz-CHARTS-full.jpg)
(source: Bloomberg;
http://graphics8.nytimes.com/images/2008/03/29/business/29-biz-CHARTS-full.jpg)
March 31, 2008 - London’s
FTSE
100 index closed at 5702.1, off 11.9 per cent for the first
three months of the year = the index’s worst opening quarter
since it was launched 24 years ago on January 3, 1984 (3Q 2000
-fell 20%); reasons -
subprime
crisis, slowing housing market (Building Society reported 5th
consecutive drop in housing prices), consumer confidence in the
UK is at its lowest for 15 years (data from pollsters
GfK/NOP
showed the confidence worsened for a seventh month in a row,
lowest level since 1993).
June 30, 2008
- End of 2nd
Q 2008:
Standard & Poor’s 500-stock index down 8.6% in June 2008, down
12.8% for the first half of 2008 = worst performance in June
since 1930 (down 16.5%).
Index introduced March 1, 1957 (with daily) estimates
(predecessor stock market indicator - Standard Statistics
Company Average of Stock Prices developed in 1926 = 100); Dow
Jones industrial average off 14.4% for the first half of 2008.
August 2, 2008 -
Half of consumers polled by Conference Board expect stock prices
to decline over next 12 months (first time); 6 previous cycles
when at least 36% of those responding were bearish.
October 2008 -
Worst September for dividends since 1956; 138 of approximately
7,000 publicly owned companies that report dividend information
to Standard & Poor's Dividend Record decreased their dividend
during third quarter of 2008 (vs. 21 in 2007); reported dividend
increases fell 21.2% to 346 from 439 reported in third quarter
of 2007.

(http://graphics8.nytimes.com/images/2008/08/02/business/0802-biz-CHARTSweb.gif)
October 2008 -
Worst September for dividends since 1956; 138 of approximately
7,000 publicly owned companies that report dividend information
to Standard & Poor's Dividend Record decreased their dividend
during third quarter of 2008 (vs. 21 in 2007); reported dividend
increases fell 21.2% to 346 from 439 reported in third quarter
of 2007.
October
2008 - Size of Market for Derivative Products.
 (http://graphics8.nytimes.com/images/2008/10/09/business/1009-web-GREENSPAN.gif)
October 8,
2008 - Total value of Dow
Jones Wilshire 5000 = about $11.7 trillion, down $7.4 trillion
(about 40%) from October 9, 2007
- stock market's all-time high; total value of all stocks = just
over $19.1 trillion.

(http://bigcharts.marketwatch.com/kaavio.Webhost/charts/big.chart?nosettings=1&symb=.dji&uf=128&type=2&size=4&sid=1643&style=320&freq=1&entitlementtoken=
0c33378313484ba9b46b8e24ded87dd6&time=13&rand=1754972358&compidx=aaaaa%3a0&ma=0&maval=9&lf=2&lf2=4&lf3=16&height=981&width=1045&mocktick=1)
October 8,
2008 - Margin debt
increased from 2002-2007 (NYSE);
July 2007 - peak of $381 billion (market peaked
in October 2007):
 (http://graphics8.nytimes.com/images/2008/10/13/business/1013-biz-MARGIN-web.gif)
October 13,
2008 - Biggest single
1-day point gain in trading history: up 936.42 points to close
at 9387.61 (11.08%); March 15,
1933 - biggest single 1-day percentage gain : up
8.26 points to close at 62.10 (15.34%).
 (http://markets.on.nytimes.com/research/tools/builder/api.asp?sym=$DJI&duration=1&chartstyle=Home&w=337&h=255&display=lineclip&topLabel=Dow%20Industrials)
November 20,
2008 - S&P 500 traded to 11-year low, down 49%
for year, down 52% from October 9, 2007 record (1,565.15);
first loss greater than 30% since 39% decline in
1937 (lost 23% in 2002, lost 29.7% in 1974, followed by annual
gains of 26%, 32%, respectively); financial companies
suffered most severe decline among 10 main industries in S&P
500, down 58% collectively (worst drop in 19-year history of
index tracking group).
December 31,
2008 - Dow Jones industrial average ended year
down more than 34%, worst year for index since 1931; broader
Standard & Poor’s 500-stock index lost more than 38%; all but 2
of the 30 Dow industrials (Wal-Mart, McDonalds) fell by more
than 11% (General Motors, Citigroup, Alcoa lost more than 70% of
their value); about $7 trillion of shareholders’ wealth (gains
of last six years) wiped out; stocks have fallen 55%-72% percent
in Brazil, Russia, India, China (so-called BRIC economies);
since September 2008
- 18 days when S.& P. moved more than 5% in either direction
(only 17 such days in previous 53 years;
source: calculations by Howard Silverblatt,
S&P an index analyst).
1999-2009
- Worst decade in 82 years of S & P 500 history (assumes CPI
unchanged January from December):
through January 2009: investor holding stocks
of S.& P.’s 500-stock index, reinvesting dividends, would have
lost about 5.1%/year, after adjusting for inflation (-2.6%/year,
before factoring in inflation); 23.5% total losses in nominal
dollars from S.& P. 500, with dividends reinvested (compounding
interest; -40.4% with inflation added);
September 30, 1929-September 30, 1939: -5%/year compound annual decline, with dividends reinvested,
before considering inflation (-2.8%/year , after factoring in
deflation); September 1964
-September 1974: compound annual decline of
4.3%/year (0.5%/year, before factoring in inflation); bad
decades often followed by 10-year periods that are better than
long-term average (gain of 6.2%/year).
 (http://graphics8.nytimes.com/images/2009/02/06/business/0207-biz-CHARTSweb.gif)
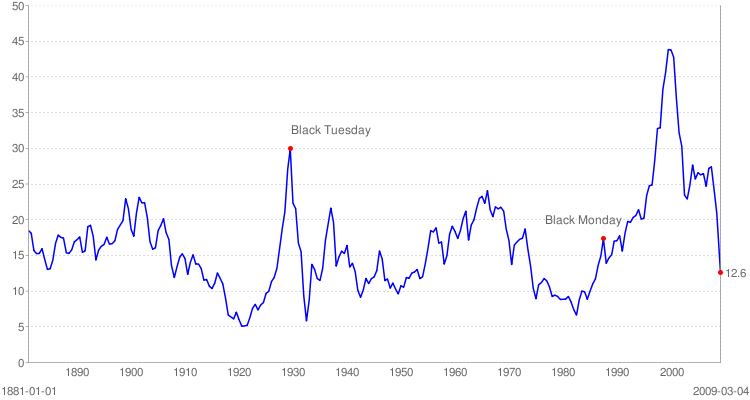
S&P 500 P/E Ratio - Monthly chart 1900-2009
(smoothed over 10 years to remove short-term volatility); July
1921 - P/E Ratio below 6; July 1932 - P/E ratio = below 6;
August 1982 - P/E of 7; 1929 - P/E Ratio = 33; 2000 - P/E Ratio
= 44
(http://www.ritholtz.com/blog/wp-content/uploads/2009/03/historic-pe-ratio-for-the-sp-500.png)
March 2009 -
82% of announced dividend changes negative
(eliminations or reductions of payouts) = highest recorded by
S.& P. since it began tallying figures in 1955.
August
3, 2009 - Best Five-Month Run Since 1938; best
July in 12 years (S&P 500 up 7.4%, 8.6% for Dow, 7.8% for Nasdaq,
9.5% for Russell); 80% of stocks above their 200-day averages
(just 1% in early March 2009); market breadth strongest in more
than year; many credit, economic indicators have recovered to
levels before Lehman Brothers's collapse in September 2008;
April-June 2009 - companies raised $92 billion in public
offerings, highest three-month issuance in two decades
 (http://s.wsj.net/public/resources/images/ON-AM325_bTrade_NS_20090731213054.gif)
October 15, 2009 -
Big Board getting smaller; closed
one of five trading halls; 2006-2009
- 36% of daily trades in stocks listed on New York
Stock Exchange executed on exchange, down about 75%
(rest conducted elsewhere, on new electronic exchanges
or through dark pools);
January 2007-October 2009 -
share price of NYSE Euronext has lost nearly
three-quarters of its value, while stock trading has
soared.
 (http://graphics8.nytimes.com/images/2009/10/15/business/1015-biz-EXCHANGE-JMP.jpg)
November
21, 2009 -
S&P 500 up 64% since it hit bottom in March 2009, to
1,100; S.& P. Europe 350 and the S.& P./Topix
150 (covering Japan) - 1) local currencies
- prices are lower than in 1998; 2) American dollars - markets
gained 20% and 7%, respectively, because of currency movements (March 24, 1998 -
S&P 500 index first reached 1,100;
1998-2009 -
U.S. = worst regional index in which to have invested;
higher returns in emerging markets [Latin America, Australia,
emerging Asian countries, Canadian index due to natural
resources stocks] than in the developed world; energy stocks -
best performing sector [oil prices fell to about $10 a
barrel in late 1998, rose above $140/barrel as company profits
set records, price is more than $70/barrel after economic
downturn]; late 1990s -
United States stock market was world leader in great bull
market; laggard more recently [weakness of the dollar];
2003-2008 -
International 700 [non-American stocks in the S.& P. Global
1,200] rose much faster in the middle of the decade, fell faster
in the global recession, up more than 80% since March 2009.
 (http://graphics8.nytimes.com/images/2009/11/20/business/1121-biz-webCHARTS.gif)
(Deutsche Borse AG), Werner G.
Seifert, Hans Hans-Joachim Voth (2006).
Invasion of the Grasshoppers. Plots - Struggles for Power -
Market Manipulation. (Berlin, Germany:
Ullsteinbuchverlage/Econ, 272 p.). Former CEO Deutsche Borse;
ICREA Research Professor at the Economics Department (Universitat
Pompeu Fabra, Barcelona), Associate Director at the Centre for
History and Economics (King's College, Cambridge). Siefert,
Werner G.; Deutsche Borse AG--Management; Executives--Germany
--Biography; Stock Exchanges--Germany--Management--Case studies.
Memoir of ouster after 12-years as CEO of
Deutsche Borse AG.
(Paris Bourse), Pedro Arbulu (2007).
La Bourse de Paris au XIXe Siècle: Efficience et Performance
d'un Marché Financier Emergent. (Paris, FR:
Connaissances et Savoirs, 252 p.). Bourse de Paris -- History --
19th century; Stock exchanges -- France -- Paris -- History --
19th century.
(Philadelphia Stock Exchange), Domenic
Vitiello, with George E. Thomas (2010).
The Philadelphia Stock Exchange and the City It Made.
(Philadelphia, PA: University of Pennsylvania Press, 253 p.).
Teaches City and Regional Planning (University of Pennsylvania);
Teaches Urban Studies (University of Pennsylvania). Philadelphia
Stock Exchange --History; Stock exchanges --Pennsylvania
--Philadelphia --History; Finance --Pennsylvania --Philadelphia
--History; Philadelphia (Pa.) --History. Metropolitan economic
development; America's first stock exchange (1790), ways it
shaped growth, decline of city around it; exchange, its
members helped spur development of early United States, its
financial sector, its westward expansion; made Philadelphia
center of industrial America: raised capital for railroads and
coal mines that connected cities to one another , built fossil
fuel-based economy; after financing Civil War, underwrote growth
of modern metropolis, its transportation infrastructure, utility
systems, real estate development; exchange's fortunes diverged
from those of city around it; became part of larger, global
institution (merged with NASDAQ in 2008).
Patricia A. Adler and Peter
Adler (1984).
The Social Dynamics of Financial Markets (Greenwich, CT:
JAI Press, 212 p.). Stock exchanges--Sociological aspects.
Christopher Armstrong (2001).
Moose Pastures and Mergers: The Ontario Securities Commission
and the Regulation of Share Markets in Canada, 1940-1980.
(Toronto, ON: University of Toronto Press, 424 p.). Ontario
Securities Commission -- History; Securities -- Ontario --
History.
Hurd Baruch (1971).
Wall Street: Security Risk (Washington, DC: Acropolis
Books, 356 p.). New York Stock Exchange
Alec Benn (2000).
The Unseen Wall Street of 1969-1975: And Its Significance for
Today (Westport, CT: Quorum Books, 216 p.). New York
Stock Exchange--History--20th century; Wall
Street--History--20th century; Stock exchanges--United
States--History--20th century.
Murray T. Bloom (1971).
Rogues to Riches; The Trouble with Wall Street. (New
York, NY: Putnam, 332 p.). Wall Street.
Marshall E. Blume, Jeremy J. Siegel and Dan
Rottenberg (1993).
Revolution on Wall Street: The Rise and Decline of the New York
Stock Exchange. (New York, NY: Norton, 320 p.). New York
Stock Exchange; Stock exchanges; International finance.
Steven R. Champion (1998).
The Great Taiwan Bubble: The Rise and Fall of Asia's Most
Volatile Emerging Market. (Berkeley, CA: Pacific View
Press). Stocks--Taiwan; Securities industry--Taiwan;
Investments--Taiwan.
Henry Clews (1887).
Twenty-Eight Years in Wall Street. (New York, NY: Irving
Publishing Co., 684 p.). Wall Street; Speculation; Capitalists
and financiers--United States; Business.
--- (1908).
Fifty Years in Wall Street. "Twenty-eight years in Wall street,"
Revised and Enlarged by a Résumé of the Past Twenty-Two Years,
Making a Record of Fifty Years in Wall Street. (New
York, NY: Irving Publishing Company, 1062 p.). Wall Street;
Speculation; Capitalists and financiers--United States;
Business.
Cedric B. Cowing (1965).
Populists, Plungers, and Progressives; A Social History of Stock
and Commodity Speculation, 1890-1936 (Princeton, NJ:
Princeton University Press, 299 p.). Stock exchanges--United
States; Investments--United States. Speculation.
David Cruise & Alison Griffiths (1987).
Fleecing the Lamb: The Inside Story of the Vancouver Stock
Exchange. (Toronto, ON: Douglas & McIntyre, 277 p.).
Vancouver Stock Exchange.
Nicolas Darvas (1964).
Wall Street: The Other Las Vegas (New York, NY: Lyle
Stuart, 192 p.). New York Stock Exchange; Stocks--United States;
Speculation.
Hillary Davis (1998). A Million a Minute:
Inside the World of Securities Trading: The Men, the Women, the
Money that Make the Markets Work. (New York, NY:
HarperBusiness, 292 p.). Ex of Baring Brothers. Stockbrokers;
Floor traders (Finance).
Pauline et Dominique Destrem (2005). La
Bourse Sous l’Occupation. (Paris, FR: Mare & Martin, 327
p.). Stock exchanges--France--History--20th century;
Securities--France--History--20th century;
France--History--German occupation, 1940-1945.
Ed. Elroy Dimson (1988).
Stock Market Anomalies. (New York, NY: Cambridge
University Press, 295 p.). Stock exchanges -- Congresses;
Capital market -- Congresses.
Helga Drummond (1996). Escalation in Decision-Making: The
Tragedy of Taurus. (New York, NY: Oxford University Press,
237 p.). Professor, Organisational Learning, Behaviour and
Change, University of Liverpool Management School. Taurus
(Project); International Stock Exchange --Data processing; Stock
exchanges --Data processing --Case studies; Decision making
--Case studies. 1986-1993 - Taurus
project, 500,000 pound project to automate settlement systems on
London Stock Exchange; how could major project promoted by Stock
Exchange, supervised by committees, advised upon by two major
consultancies, staffed by experienced technical team go wrong?
why was decision to abandon project not made earlier?
Franics L. Eames (1968). The New York Stock
Exchange (New York, NY: Greenwood Press, 139 p. [Reprint
1894 ed.]). New York Stock Exchange.
Alexander Elder (2006).
Entries & Exits: Visits to 16 Trading Rooms. (Hoboken,
NJ: Wiley, 341 p.). Investment analysis; Stocks; Futures.
Psychology, tactics, risk
control, record keeping, decision-making process of traders in
16 trading rooms.
Christopher Elias (1971).
Fleecing the Lambs (Chicago, IL: Regnery, 246 p.). New
York Stock Exchange.
Ernest Feydeau (1873). Mémoires d'un
Coulissier. (Paris, FR: Librairie Nouvelle, 317 p. [2nd
ed.]). Stock jobber at Paris Borse. Paris Bourse.
Justin Fox (2009).
The Myth of the Rational Market: A History of Risk, Reward and
Delusion on Wall Street. (New York, NY: Collins, 400
p.). Business and Economics Columnist (Time magazine). Rational
expectations (Economic theory); Economics --Psychological
aspects; Economics --History; Wall Street (New York, N.Y.).
Rise
and fall of efficient market theory, century-long making of
modern financial industry; people, ideas that forged modern
finance and investing, from formative days of Wall Street
through Great Depression, into financial calamity of today;
efficient market hypothesis (EMH) evolved into powerful myth; new wave of economists, scholars who
no longer teach that investors are rational, that markets are
always right; EMH given way to counterintuitive hypotheses about
human behavior, psychological models of decision making,
irrationality of markets (investors overreact, underreact, make
irrational decisions based on imperfect data); economic
behaviors, markets shaped by gradually refined theory that stock
market prices are random, perfectly rational.
John Francis (1851). Chronicles and
Characters of the Stock Exchange ... (London, UK: Longman,
Brown, Green, & Longmans, 361 p. [2nd ed.]). Stock Exchange
(London, England); Speculation.
Martin S. Fridson (1993).
Investment Illusions: A Savvy Wall Street Pro Explodes Popular
Misconceptions About the Markets. (New York, NY: Wiley,
230 p.). Investment analysis; Stocks; Bonds; Securities.
--- (1998).
It Was a Very Good Year: Extraordinary Moments in Stock Market
History. (New York, NY: Wiley, 244 p.). Managing
Director (Merrill Lynch). Investments -- United States --
History; Stocks -- United States -- History.
John G. Fuller (1962).
The Money Changers
(New York, NY: Dial Press, 247 p.). New York Stock Exchange;
Stocks -- United States.
Charles Gasparino (2007).
King of the Club: Richard Grasso and the Survival of the New
York Stock Exchange. (New York, NY: Collins, 400 p.).
Correspondent for CNBC, Former Writer (Wall Street Journal and
Newsweek). Grasso, Richard; New York Stock Exchange--Officials
and employees--Biography; Corporations--Corrupt
practices--United States--Case studies. Most influential CEO in New York
Stock Exchange's history, mastered subtle deal-making, politics;
brought heart of global finance back from near-death after
September 11; NYSE Board rewarded him with a pay package (more
than $140 million in deferred compensation) - generated
hailstorm of protest; bitter divisions, investigation from
Attorney General, eventual downfall.
Paul Gibson (1993).
Bear Trap: Why Wall Street Doesn't Work (New York, NY:
Atlantic Monthly Press, 246 p.). New York Stock Exchange --
History; Securities industry -- United States -- History;
Stockbrokers -- United States.
Susan Goldenberg (1986).
Trading: Inside the World's Leading Stock Exchanges.
(San Diego, CA: Harcourt Brace Jovanovich, 263 p.). Stock
exchanges.
John Steele Gordon (1988).
The Scarlet Woman of Wall Street: Jay Gould, Jim Fisk, Cornelius
Vanderbilt, the Erie Railroad Wars and the Birth of Wall Street
(New York, NY: Weidenfeld & Nicolson, 421 p.). Erie Railroad,
Panic of 1873, New York Stock Exchange.
Leo Gough (1998).
25 Investment Classics: Insights from the Greatest Investment
Books of All Time (London, UK: Financial Times: Pitman
Pub., 238 p.). Investment; Speculation.
Stephen Green (2004).
The Development of China's Stock Market, 1984-2002: Equity
Politics and Market Institutions. (New York, NY:
Routledge, 287 p.). Stock exchanges China; China Economic policy
1976-2000; China Economic policy 2000-.
Lucy Heckman (1992).
The New York Stock Exchange: A Guide to Information Sources.
(New York, NY: Garland, 353 p.). Librarian (St. John's
University). New York Stock Exchange--Bibliography.
--- (2001).
NASDAQ: A Guide to Information Sources. (New York, NY:
Garland, 250 p.). Librarian (St. John's University). Nasdaq
Stock Market; Nasdaq Stock Market--Bibliography; National
Association of Securities Dealers.
Mark Ingebretsen (2002).
Nasdaq: A History of the Market That Changed the World.
(Roseville, CA: Prima, 334 p.). Nasdaq Stock Market--History.
Alan Jenkins (1973).
The Stock Exchange Story. (London, UK: Heinemann, 212
p.). Stock Exchange (London, England)--History.
Frank Keane (1981).
The Vancouver Stock Exchange: From Bucketshop to World Venture
Money Capital. (Vancouver, BC: Chinook Communications,
127 p.). Vancouver Stock Exchange.
Alan Lechner (1980).
Street Games: Inside Stories of the Wall Street Hustle
(New York, NY: Harper & Row, 176 p.). Wall Street
Louis Lowenstein (1988).
What's Wrong with Wall Street: Short-Term Gain and the Absentee
Shareholder. (Reading, MA: Addison-Wesley, 268 p.).
Stocks; Institutional investments; Stockholders; Tender offers
(Securities).
Maggie Mahar (2003).
Bull!: A History of the Boom, 1982-1999: What Drove the
Breakneck Market-- and What Every Investor Needs To Know about
Financial Cycles.
(New York, NY: HarperBusiness, 486 p.). Wall
Street--History--20th century; Stock exchanges--United
States--History--20th century; Business cycles; Stock Market
Bubble, 1995-2000.
Joseph Gregory Martin (1969). A Century of
Finance; Martin's History of the Boston Stock and Money Markets,
One Hundred Years, from January, 1798, to January, 1898,
Comprising the Annual Fluctuations of All Public Stocks and
Investment Securities ... also a review of the Boston Money
Market, 1831 to 1898 ... With Full Descriptive Notes Relating to
the Different Securities, the Whole Covering a Complete Century
of Varied Monetary Experiences. Uniform Title: [Twenty-one years
in the Boston stock market]. (New York, NY: Greenwood Press,
262 p. [reprint of 1898]). Boston; Stock Exchange; Banks and
banking--Massachusetts--Boston; Boston (Mass.)--Commerce.
Martin Mayer (1955).
Wall Street: Men and Money. (New York, NY: Harper, 274
p.). New York Stock Exchange.
--- (1988).
Markets: Who Plays, Who Risks, Who Gains, Who Loses.
(New York, NY: Norton, 303 p.). Stock exchanges; Securities.
--- (2001).
The Fed: The inside Story of How the World's Most Powerful
Financial Institution Drives the Markets. (New York, NY:
Free Press, 350 p.). Board of Governors of the Federal Reserve
System (U.S.); Monetary policy--United States; Stock
exchanges--United States.
David McClain (1988).
Apocalypse on Wall Street (Homewood, IL: Dow
Jones-Irwin, 187 p.). New York Stock Exchange; Stock exchanges;
Wall Street; Program trading (Securities).
J. Edward Meeker (1975).
The Work of the Stock Exchange (New York, NY: Ayer Pub.
Co., 720 p. [rev. ed.]). New York Stock Exchange
Ranald C. Michie (1987).
The London and New York Stock Exchanges, 1850-1914.
(London, UK: Allen & Unwin, 312 p.). Department of History
(University of Durham). Stock Exchange (London,
England)--History; New York Stock Exchange--History.
--- (1999).
The London Stock Exchange: A History. (New York, NY:
Oxford University Press, 672 p.). Department of History
(University of Durham). Stock Exchange (London,
England)--History.
--- (2007).
The Global Securities Market: A History. (Oxford, UK:
Oxford University Press, 399 p.). Department of History
(University of Durham). Securities industry -- History;
Securities -- History. Securities markets from its beginnings in Medieval Venice
through Amsterdam, London to its operations in Tokyo, New York
today.
Merton H. Miller (1991).
Financial Innovations and Market Volatility. (Cambridge,
MA: Blackwell, 288 p.). Capital market -- United States; Finance
-- United States; Stocks -- Prices -- United States; Stock
Market Crash, 1987 -- History.
Gregory J. Millman (1999).
The Day Traders: The Untold Story of the Extreme Investors and
How They Changed Wall Street (New York, NY: Times
Business, 253 p.). Electronic trading of securities;
Stocks--Data processing.
Anne L. Murphy (2009).
The Origins of English Financial Markets: Investment and
Speculation Before the South Sea Bubble. (New York,
NY: Cambridge University Press, 283 p.). Lecturer in the
Department of History (University of Exeter). Financial
institutions --England --History --17th century; Speculation
--England --History --17th century; Investments --England
--History --17th century; Financial institutions --England
--History --18th century; Speculation --England --History --18th
century; Investments --England --History --18th century.
English
Financial Revolution; English investors in 1690s – England
emerging market economy; choices, actions of investors who
enthusiastically embraced London's new financial market: host of
joint-stock companies emerged, offered opportunity for
investment in projects; state employed innovative tactics to attract
money (demands of Nine Years' War): Bank of
England incorporated; interactions between public, private
finance; how information circulated around market, used by speculators
and investors; establishment of institutions - Bank of England,
national debt, active secondary market in that debt - on which
England's financial system was built.
Russell Napier (2009).
Anatomy of the Bear: Lessons from Wall Street's Four Great
Bottoms. (Hampshire, UK: Harriman House, 320 p. [2nd
ed.]). Consultant with CLSA (Credit Lyonnais SA). Financial
crises -- United States; Stock exchanges -- New York -- New
York; Securities industry -- United States. Four occasions when
US equities were particularly cheap - 1921, 1932, 1949, 1982 -
how spot the bottom?; how markets really did work in these
bear-market bottoms.
Richard Ney (1970).
The Wall Street Jungle (New York, NY: Grove Press, 348
p.). Stock exchanges--United States; Stocks--United States.
John Lloyd Parker (1932).
Unmasking Wall Street. (Boston, MA: The Stratford
Company, 223 p.). New York Stock Exchange; Wall Street;
Capitalists and financiers -- United States.
Ferdinand Pecora (1939).
Wall Street Under Oath; The Story of Our Modern Money Changers
(New York, NY: Simon & Schuster, 311 p.). New York Stock
Exchange.
Elliott Posner (2009).
The Origins of Europe’s New Stock Markets.
(Cambridge, MA: Harvard University Press, 242 p.). Associate
Professor of Political Science (Case Western Reserve
University). Stock exchanges --Europe; Capital market --Europe;
Finance --Europe. Causes of Europe's emergence as global
financial power; origins of markets, their relationship to
politics and bureaucracy.
W.J. Reader (1979).
A House in the City: A Study of the City and of the Stock
Exchange Based on the Records of Foster & Braithwaite, 1825-1975
(London, UK: Batsford, 198 p.). Stock Exchange (London,
England)--History; Foster & Braithwaite (Firm)--History.
Eric Rosenthal (1968). On 'Change Through
the Years; A History of Share Dealing in South Africa. (Cape
Town, S. Africa: Flesch Financial Publications, 271 p.).
Johannesburg Stock Exchange; Stock exchanges--South Africa.
John Rothchild (1998).
The Bear Book: Survive and Profit in Ferocious Markets.
(New York, NY: Wiley, 284 p.). Stock exchanges; Bear market.
Anthony Rowley (1987).
Asian Stockmarkets : The Inside Story (Homewood, IL: Dow
Jones-Irwin, 290 p.). Securities--Asia; Stock exchanges--Asia.
Stephen Salsbury and Kay Sweeney (1992).
Sydney Stockbrokers: Biographies of Members of the Sydney Stock
Exchange, 1871 to 1987. (Sydney, NSW: Hale & Iremonger, 466
p.). Sydney Stock Exchange--History;
Stockbrokers--Australia--Biography.
Henk Schoorl (1969). Isaac le Maire,
Koopman en Bedijker. (Haarlem, The Netherlands: H. D.
Tjeenk Willink, 224 p.). Maire, Isaac le, 1558-1624; Reclamation
of land --Netherlands --Huisduinen; Dikes (Engineering);
Engineers --Correspondence, reminiscences, etc.
Robert J. Shiller (1989).
Market Volatility. (Cambridge, MA: MIT Press, 464 p.).
Stocks -- Prices; Stock exchanges; Bonds -- Prices; Real
property -- Prices.
Eds. Birl E. Shultz and Albert P. Squier
(1963).
The Securities Market - and How It Works. (New York, NY:
Harper & Row, 372 p. [rev. ed.]). New York Stock Exchange; Stock
exchanges -- United States.
Leonard Sloane (1980).
The Anatomy of the Floor: The Trillion-Dollar Market at the New
York Stock Exchange. (Garden City, NY: Doubleday, 228
p.). New York Stock Exchange.
Adam Smith (1968).
The Money Game. (New York, NY: Random House, 302 p.).
Stock exchanges--United States; Investments--United States.
--- (1972).
Supermoney. (New York, NY: Random House, 301 p.). Stock
exchanges--United States; Investments--United States.
Charles W. Smith (1999).
Success and Survival on Wall Street: Understanding the Mind of
the Market. (Lanham, MD: Rowman & Littlefield, 220 p.).
Investments--United States; Stock exchanges--United States.
Roy
C. Smith (2010).
Paper Fortunes: Modern Wall Street: Where it’s Been and Where
it’s Going. (New York, NY:
St. Martin’s Press,, 448 p.). Kenneth Langone
Professor of Entrepreneurship and Finance at Stern School (New
York University), Former Investment Banker at Goldman Sachs. New
York Stock Exchange --History; Finance --United States
--History; Investments --United States --History; Investment
banking --United States --History; Investment advisors --United
States --History. Wall Street from
post-war heyday to present; how industry has grown, changed,
evolved; its future prospects are; shifting U.S. market economy
through actions of people who've shaped it for last 60 years,
will shape it for next 60 years. .Wall Street from post-war
heyday to present; how industry has grown, changed, evolved; its
future prospects are; shifting U.S. market economy through
actions of people who've shaped it for last 60 years, will shape
it for next 60 years.
Robert Sobel (1970).
The Curbstone Brokers; The Origins of the American Stock
Exchange. (New York, NY: Macmillan, 296 p.). American
Stock Exchange.
--- (1972).
Amex: A History of the American Stock Exchange, 1921-1971.
(New York, NY: Weybright and Talley, 372 p.). American Stock
Exchange.
--- (1975).
N.Y.S.E. : A History of the New York Stock Exchange, 1935-1975.
(New York, NY: Weybright & Talley, 398 p.). New York Stock
Exchange-History.
--- (1977).
Inside Wall Street : Continuity and Change in the Financial
District. (New York, NY: Norton, 288 p.). New York Stock
Exchange; Wall Street.
--- (2000).
The Pursuit of Wealth: The Incredible Story of Money Throughout
the Ages. (New York, NY: McGraw-Hill, 347 p.).
Money--History; Investments--History.
Robert Sobel with a foreword by Broadus
Mitchell (1965).
The Big Board; A History of the New York Stock Market
(New York, NY: Free Press, 395 p.). New York Stock Exchange.
George Soros; foreword by Paul Tudor Jones II
(1994).
The Alchemy of Finance: Reading the Mind of the Market.
(New York, NY: Simon & Schuster, 367 p.). Investments.
Roger W. Spencer, John H. Huston (2006).
The Federal Reserve and the Bull Markets: From Benjamin Strong
to Alan Greenspan. (Lewiston, NY: Edwin Mellen Press,
251 p.). United States. Federal Reserve Board; Bull
markets--United States; Stock exchanges--United States.
Relationship of Federal Reserve
policy to stock market activity; monetary policy responses of
Benjamin Strong, William McChesney Martin Jr., Alan Greenspan to
three major bull markets that occurred during their respective
tenures.
Richard J. Teweles and Edward S. Bradley
(1998).
The Stock Market (New York, NY: Wiley, 568 p. [7th
ed.]). Stock exchanges.
William Arthur Thomas (1986).
The Stock Exchanges of Ireland. (Wolfeboro, NH: F.
Cairns, 273 p.). Stock exchanges--Ireland--History. Series:
Studies in financial and economic history.
--- (2001).
Western Capitalism in China: A History of the Shanghai Stock
Exchange. (Alershot: Ashgate, 328 p.). University of
Liverpool. Shanghai zheng quan jiao yi suo--History; Stock
exchanges--China--Shanghai--History; Investments,
Foreign--China--Shanghai--History; Shanghai (China)--Economic
conditions.
William C. Van Antwerp (1975).
The Stock Exchange from Within (New York, NY: Arn0
Press, 459 p. [Reprint of 1913 ed.]). New York Stock Exchange;
Stock-exchange.
Carl E. Walter and Fraser J.T. Howie (2001).
"To Get Rich Is Glorious!": China’s Stock Markets in the ’80s
and ’90s. (New York, NY: Palgrave, 243 p.). Managing
Director, China International Capital Corporation; Sales and
Trading Department, China International Capital Corporation.
Stock exchanges--China; Stocks--China; Securities--China;
Industries--China--Finance; Capitalism--China.
--- (2006).
Privatizing China: Inside China’s Stock Markets.
(Hoboken, NJ: Wiley, 335 p. [2nd ed.]). Managing Director of JP
Morgan, Chief Operating Officer of its China businesses;
Independent Financial Analyst located in Beijing. Stock
exchanges--China; Stocks--China; China--Economic
conditions--2000-. How
markets have developed from their early dominance by local
governments to ones that are controlled and deliberately
manipulated by central government in pursuit of its policy
goals.
Eric J. Weiner (2005).
What Goes Up: The Uncensored History of Wall Street Told by the
Bankers, Brokers, CEOs, and Crooks Who Made It. (New
York, NY: Little, Brown, 512 p.). Former Dow Jones Journalist.
New York Stock Exchange--History; Wall Street (New York,
N.Y.)--History. Oral
history lessons from the past, warnings for the future.
Chris Welles (1975).
The Last Days of the Club (New York, NY: Dutton, 460
p.). New York Stock Exchange.
Jennifer Wells (1991).
The Pez: The Manic Life of the Ultimate Promoter.
(Toronto, ON: Macfarlane Walter & Ross, 277 p.). Pezim, Murray;
Vancouver Stock Exchange; Capitalists and financiers--British
Columbia--Vancouver--Biography; Stockbrokers--British
Columbia--Vancouver--Biography.
Walter Werner and Steven T. Smith (1991).
Wall Street (New York, NY: Columbia University Press,
306 p.). New York Stock Exchange--History--19th century;
Securities--United States--History--19th century;
Finance--United States--History--19th century; United
States--Economic conditions--To 1865.
Richard R. West with Seha M. Tinic (1971).
The Economics of the Stock Market (New York, NY: Praeger,
222 p.). New York Stock Exchange; Stock exchanges; Stocks.
Barrie A. Wigmore (1985).
The Crash and Its Aftermath : A History of Securities Markets in
the United States, 1929-1933. (Westport, CT: Greenwood
Press, 731 p.). Stock exchanges--United States--History--20th
century; Depressions--1929--United States; Stock Market Crash,
1929.
--- (1997).
Securities Markets in the 1980s : The New Regime, 1979-1984.
(New York, NY: Oxford University Press, 399 p.).
Securities--United States; Capital market--United States.
Barnie F. Winkelman (1932).
Ten Years of Wall Street. (Philadelphia, PA: The John C.
Winston Company, 381 p.). Speculation; Stocks; Stock
exchanges--United States; Depressions--1929; Wall Street (New
York, N.Y.).
T.A. Wise and the editors of Fortune (1962).
The Insiders; A Stockholder's Guide to Wall Street
(Garden City, NY: Doubleday, 247 p.). New York Stock Exchange.
Carol Z. Womack, Alice C. Littlejohn (1995).
The American Stock Exchange: A Guide to Information Resources.
(New York, NY: Garland Pub., 225 p.). American Stock Exchange --
Bibliography; Stock exchanges -- New York (State) -- New York --
Bibliography.
James Playsted Wood (1966).
What's the Market? The Story of Stock Exchanges (New
York, NY: Duell, Sloan and Pearce, 179 p.). Stock-exchange;
Securities.
Robert E. Wright (2005).
The First Wall Street: Chestnut Street, Philadelphia, and the
Birth of American Finance. (Chicago, IL: University Of
Chicago Press, 208 p.). Clinical Professor of Economics in the
Stern School of Business (New York University. Stock
exchanges--Pennsylvania--Philadelphia--History; Stock
exchanges--New York (State)--New York--History; Stock
exchanges--United States--History. History of the United States and
the origins of its unrivaled economy.
Russell O. Wright (2002).
Chronology of the Stock Market. (Jefferson, NC:
McFarland, 128 p.). New York Stock Exchange--History; Stock
exchanges--New York (State)--New York--History; Stock
exchanges--United States--History.
Michael G. Zahorchak (1974).
Favorable Executions; The Wall Street Specialist and the Auction
Market (New York, NY: Van Nostrand Reinhold Co., 189
p.). Stock exchanges--United States; Stocks--Prices;
Stockbrokers--United States.
_________________________________________________________________________________
Business
History Links
The Big Picture
http://bigpicture.typepad.com/
Macro perspective on capital markets. the economy, geopolitics,
technology and digital media by Barry L. Ritholtz, CEO and
Director of Equity Research at FuisonIQ, an online quantitative
research firm (former Chief Market Strategist for Maxim Group,
New York Investment bank).
Center for Research in Securities Prices
(CRSP
http://www.crsp.chicagogsb.edu/
CRSP is dedicated in its goal to provide the most complete,
accurate, and easily usable securities data to all of its users.
1959 - Louis Engel, vice president at the firm
then known as Merrill Lynch, Pierce, Fenner & Smith, inquired of
Professor James H. Lorie (Ph.D. 1947; Associate Dean 1956;
Professor of Business Administration at University of Chicago
Graduate School of Business) as to whether investment
performance in the stock market relative to other types of
investments had been analyzed. Such an analysis was not feasible
as no comprehensive stock market database was available at the
time. Professor Lorie proposed that Merrill Lynch provide funds
for a project with the purpose of constructing the stock
database. The work would involve gathering, cleaning, and
including the prices, dividends, and rates of return of all
stocks listed and trading on the NYSE since 1926. The work would
also include calculating rates of returns for those same stocks.
1960 - CRSP, with a grant of $300,000 from Merrill
Lynch, was established; 1964 - the stock market
database was estimated to contain between two and three million
pieces of information; 1984 - added data from the
NASDAQ markets (from December 1972); mid 1990s -
created the only complete database available containing active
and inactive mutual funds; 2005 - released the
CRSP/Ziman Real Estate Data Series together with the Ziman
Center at the Anderson School of Business (UCLA); 2006
- released Pre62 database, which contains daily data from 1926 -
1962 (previously only monthly data was available for this time
period.
Cincinnati Stock
Exchange
http://www.cincinnatistockexchange.us/
First fully automated stock market in the world, the Cincinnati
Stock Exchange made stocks and securities more accessible to the
public and revolutionized the financial industry. A
collaborative project of the UC Journalism Program and the
Cincinnati Historical Society.
Daily Closings of the Dow Jones
Industrial Average (DJIA)
http://eh.net/hmit/dow
Data cover period from DJIA inception, on May 26, 1896, to the
present.
Charles Dow, the History of the Dow
Jones Averages, Dow Jones Averages Chronology 1884 - 1995
http://www.cftech.com/BrainBank/FINANCE/DowJonesAvgsHist.html
Dow Jones Indexes
http://indexes.dowjones.com/mdsidx/
Dow Jones Indexes develops, maintains and licenses market
indexes for investment products. Among its more than 3,000
indexes are the world's best known stock indicator, the Dow
Jones Industrial Average, and the leading pan-European indexes,
the Dow Jones STOXX Indexes. Dow Jones Indexes is an
independent, full-service index provider, supplying accurate,
reliable and transparent index data. The indexes are maintained
according to a clear, transparent and systematic methodology
that is fully integrated across all Dow Jones equity index
families. This methodology, together with historical data for
all Dow Jones indexes, is open for review and is made available
at no cost to the professional investment community.
Dow Jones
Interactive Learning Center
http://www.djindexes.com/DJIA110/learning-center/
The Dow Jones Industrial Average is considered to be an
effective gauge of the U.S. economy, and overall investor
sentiment. For those who keep close track of the Dow, it is
something to be watched ever so closely. This website serves as
a place to learn about the Dow in all its glory, ranging from
pieces of trivia to a nice historical timeline. It’s probably
best to start with the historical timeline. Here users will
learn about what happened to the twelve original companies
listed on the Dow when it first debuted on May 26, 1896. After
that, they are free to move through the rest of the timeline,
learning about the technological innovations that the Dow
embraced over time, and also about some of the darkest days it
has encountered. The trivia section is a true treat, as visitors
can learn how much they would have today if their parents had
invested $1,000 on the date of their birth, and then also find
out about some of the Dow’s top performers over the past century
or so.
New York Stock
Exchange: Firsts & Records
http://www.nyse.com/about/history/1022221392987.html
From its formation under the Buttonwood Tree
in 1792 to the creation of NYSE Euronext in 2007, the NYSE has
experienced many historic firsts, surpassed major milestones and
set new records.so.
Securities Industry Association
http://www.sia.com/
Established in 1972 through the merger of the Association of
Stock Exchange Firms (1913) and the Investment Banker's
Association (1912). SIA brings together the shared interests of
more than 600 securities firms to accomplish common goals.
According to the Bureau of Labor Statistics, the U.S. securities
industry employs more than 800,000 individuals. Industry
personnel manage the accounts of nearly 93-million investors
directly and indirectly through corporate, thrift, and pension
plans. In 2003, the industry is projected to generate $142
billion in domestic revenue and $283 billion in global revenues.

return to top |